Enrollment Report Provides 10-Year Projections for FHSD
Forest Hills School District recently received a completed enrollment projection report that was conducted by FutureThink, a third-party company that has been working in this field with school districts and other agencies across the country since 2006. The completed study was presented by FutureThink to the FHSD Board of Education during a special meeting on Tuesday, September 16, 2025.
FutureThink utilizes data including historical enrollment trends, live birth rates, population estimates, available housing information and other variables to calculate projected enrollment numbers that are broken down by school building and grade level. In order to capture a full, detailed explanation of the different variables and how they impacted FHSD’s specific enrollment projections, you can read the full report here.
Key Data Used to Calculate Projections
Here is a simplified summary of some of those key data points:
- Historical Enrollment and Enrollment Trends
- FHSD experienced an 8% decrease over the past 10 years (595 students). This is similar to the decline in overall public school enrollment in Ohio of 7% since 2014. (Pages 14 and 6)
- Since 2014, there has been a steady decline in public school enrollment nationwide due, in significant part, to declining birth rates. (Page 2)
- Based on available data from the U.S. Department of Education, public school enrollment in Ohio is projected to decrease by 7% from fall 2022 to fall 2031. (Page 4)
- Live Birth Rates
- National and state data both indicate an overall decline in birth rates over recent years. Ohio births declined by 12,760 from 2007 to 2011. After leveling off from 2011 to 2014, births have declined each year with an exception for a slight uptick between 2020 and 2021. From 2022 to 2023, births declined by approximately 1%. (Page 20)
- From 2009 to 2022, live births in three primary zip codes for FHSD declined from 966 to 833. After a drop in 2023, new data presented during the special board meeting shows births in 2024 at 830. (Page 21 and Board Presentation)
- Population Estimates
- Available data projects a total change in Ohio population from ages 0-18 at -4.4% from 2024 to 2029. The decrease in age groups 5-9 and 15-18 are -8.2% and -5.8%, respectively. (Page 25)
- The same data sources project FHSD to see a similar, but slightly smaller decrease in total population for these age groups. The change over ages 0-18 is projected at -3.9%. (Page 26)
- The total population (all ages) in FHSD is projected to increase over the same time period by 1.1%, which indicates an aging population. (Page 26)
- Housing Information
- In Anderson Township, there are a total of 873 housing units either recently completed, under construction or planned. (Page 34)
- Survival Ratios
- This data point analyzes the change in school enrollment year-over-year by grade level (first grade in year 1 is compared to second grade in year 2, for example).
- From 2015 to 2023, FHSD shows a more than 100% average survival ratio for all grade changes into the high school level. At that age range, the average survival ratio sits at 99.5% for grades 9-10, 99.4% for grades 10-11 and 99.3% for grades 11-12. This indicates that the vast majority of students who enroll in FHSD typically stay in the school system. (Page 35)
Enrollment Projections 2025-2026 to 2034-2035
Enrollment districtwide is expected to decline by 4.9% over the time period of the projections, which is a smaller decrease than the total decline in Ohio public school enrollment. The statewide enrollment is projected to decline by approximately 7% through fall 2031. The report shows an increase in enrollment for the preschool program and grades K-2, with a projected decrease for higher grades.
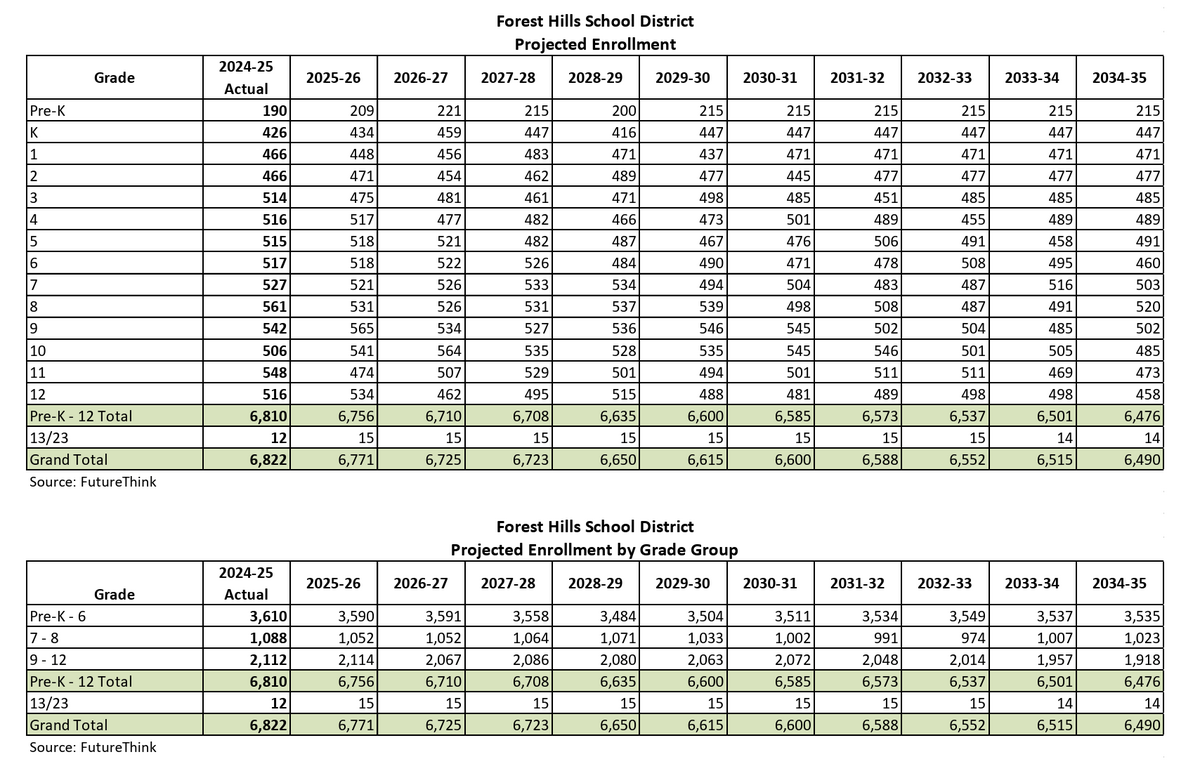
Two schools, Sherwood Elementary and Summit Elementary, are actually projected to see an increase in student enrollment despite an overall decrease across the entire school district. You can see specific, school-by-school and grade-by-grade projections on pages 38-41 in the enrollment report.
District leaders are now working to use this new data to inform facility planning, projections for staffing levels and to guide other financial and operational discussions. Grades preschool-6 are projected to decline by 75 students, grades 7-8 by 65 students and grades 9-12 by 194 students. In order to understand the potential impact on staffing, these decreases have to be factored across 14 grade levels, six elementary schools and two high schools.